Life Hacking: Adding Geographical Filters to Flat Search Websites with Turf.js
Contents
Flat hunting can be a big pain - particularly for European metropoles. Most flat search platforms already offer good filter options but until now, I didn’t see any with custom geographic filters. Apart from drawing your own area of interest on a map, you seldomly find filters such as “How far is the next metro stop?” or “How close are important facilities?”.
This article will show a quick and universal workaround for custom geographic filters based on the fantastic pure javascript GIS Turf.js. I implement a buffer based on Milano’s metro stops, verify that the flat is located within the buffer and open the respective offer in a new browser tab.
For Italy, one of the biggest platforms is idealista. They already offer plenty of filters and a custom polygon drawing option which is a good base to build on! The workflow described here can be applied to any platform if the data is accessible.
What do we want?
Before jumping in, let’s first think about what we really want. We would like to find a flat:
- as cheap as possible
- satisfying our needs
- in our area of interest
For all those criteria idealista already provides good filters:
- a price range
- lots of filters (smoking, pets, garage, elevator…)
- custom drawing option
But for the metro proximity there is nothing we can do apart from searching manually on the map. Only this procedure is a pain, as we can’t customize Google Maps on their page, to show metro stops on any zoom level. So as soon as you zoom out too much, metro stops are gone and you’re lost in the real estate jungle.
Metro proximity
Technically, we don’t want our flat to be close to the metro Ⓜ️, but we want to have a short walking distance which is a different thing. But for our usecase it would obvioulsy be overkill, to calculate walking isochrones around the stops. A radius will do the job just fine.
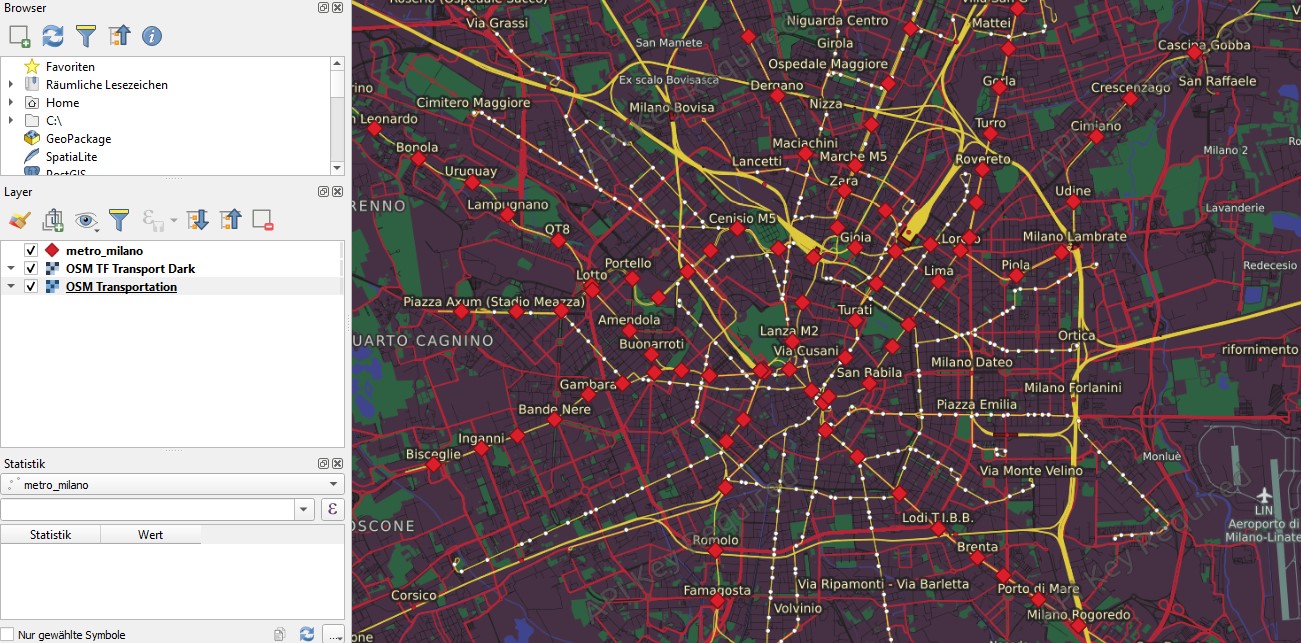
Let’s download the respective geojson right from Milano’s open data page and visualize it in QGIS to get a first overview. The QGIS plugin QuickMapServices quickly streams different OSM tiles to our canvas. I just discovered the “OSM Transportation” tiles or the dark pendant “OSM TF Transport Dark”. They are both perfectly suited as a background layer and to get the metro stop names.
When reprojected to “EPSG:3857”, we can perform the simple buffer operation in meters. Otherwise in 4326, as the unit is degrees, in QGIS the buffer radius can’t be set to meters.
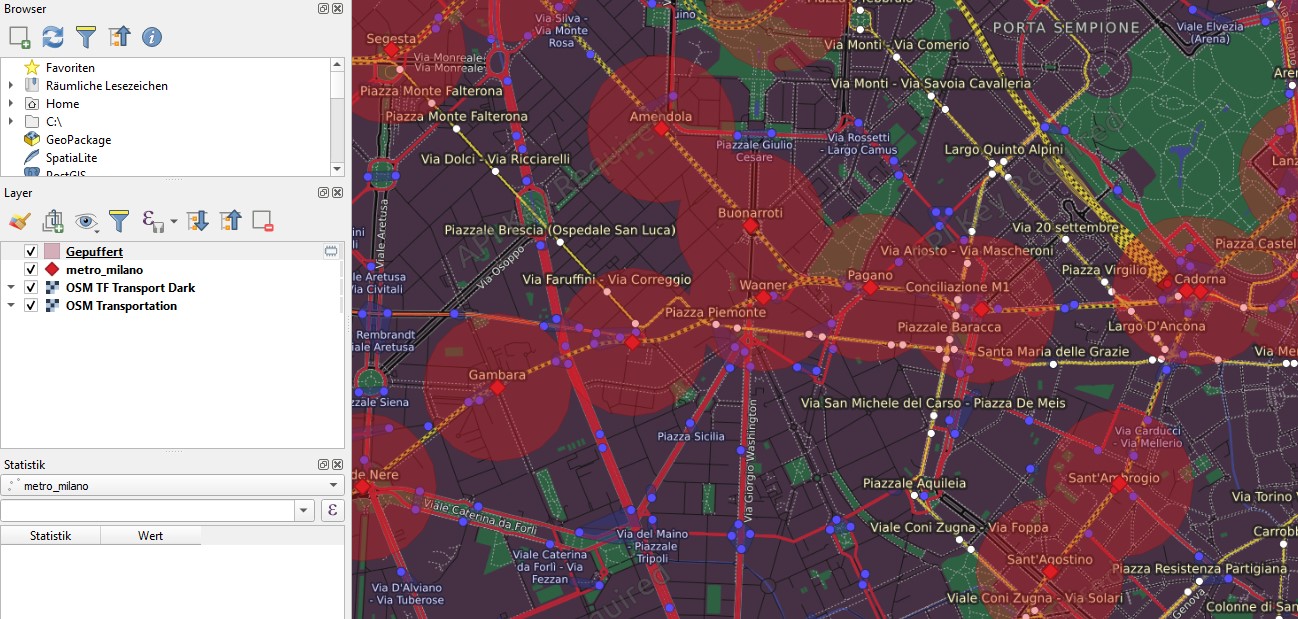
A reasonbale walking distance is approximately 5 mins. The approximate walking speed of a pedestrian is around 5 km/h or 1.38 m/s, so this would lead to a buffer of 414 meters but let’s make 500 out of it. If you found that there are too many results as in my case, just lower the distance to i.e. 350 meters (or lower the max price ;) ). A 350 meter buffer would look like this.
Get your hands dirty!
Before writing this article I considered using Python but as my aim was to make it reproducible to people without programming knowledge, so plain js/jquery seemed a better option.
Technically we need to do the following:
- Load jquery and turf.js for geospatial processing
- Load the metro geojson
- Get the results from idealista
- Perform the point-in-polygon operation
- Finally open the results in new browser tabs
Preparation
Metro stops
Go to Milano’s open data portal and copy the geojson: Ⓜ️
| |
Note that instead of metro stops, you could enter anything else, for example schools for your children, city parks or restaurants. You just need a valid geojson either containing points as in our case or polygons.
Idealista query results
- Go to idealista, enter your search criteria and draw your area of interest.
- Zoom in until you see markers instead of circles.
- Press F12 to open the developer tools. Go to network tab, only activate XHR and look for an ajax request starting with
drawsearchmap.ajax?locationUri=.... Copy this request. This is technically idealista’s API or how they display results on the map after you entered your filters. 📝
Isn't this illegal?
Short answer: no. Until now, you didn’t even do anything but inspecting the page. Later on, we will do two things:
- Fire the above request and
- open the browser tabs.
Firing the request won’t cause any harm as you just request the data as the regular webpage does. Nothing illegal here. Depending on how many results remain in the end, it could happen that you open too many tabs if you entered loose criteria and let’s say 200 results remain. In this case you probably wouldn’t like to open all of them but in smaller batches of i.e. 10. This is not only in your interest but also in idealista’s.
Even if you opened 200 tabs in your browser, there is nothing wrong here - the worst that can happen is that idealista (or any other page your bombarding with requests) will block you temporarily.
If you’d do the same thing with millions of requests it’s called a DDoS attack which is illegal. However, don’t worry about this as your computer would definitely crash before you caused serious harm to anyone ;).
DISCLAIMER: This is not a legal advice but only a technical description of what’s going on. Don’t do what I describe here if you do not understand what you’re doing. You do everything at your own risk!
Ready to go!
Go back to the browser tab with your idealista results. Now go to console (F12) and enter the following code parts one after another. There are three parts and you can modify any of it if needed.
1. Loading scripts and metro stops
Insert the geojson from https://dati.comune.milano.it/dataset/ds535_atm-fermate-linee-metropolitane/resource/dd6a770a-b321-44f0-b58c-9725d84409bb/view/470b1dfe-8c7b-48e1-ba0b-85fd29ff7bb6 in the metro_raw variable by simply replacing the two brackets standing for a JSON object.
In case you want to work with a different geojson, just insert a different one.
| |
Copy everything to the console and enter.
2. Buffer and request idealista results
Adjust the buffer radius to your needs. You can even change the unit to miles or other units if you like. Just see the respective turf.js manual. 📝
Replace my dummy request with yours.
| |
3. Extract listing IDs
With these two lines you already get the listing IDs. ⛏️
| |
After you executed the below lines, just type ids and you’ll get all listing IDs falling in your buffer.
You can use them to access the offer directly in your browser if you simply type https://www.idealista.it/immobile/<yourid> and replace <yourid> with the ID i.e. 12345678.
If you want to play it safe, just copy these ids to a textfile of your choice and look through each listing manually.
In case of a low total listing number like 5-10, you can open the tabs in your browser automatically with:
| |
If you prefer the English site, just add en to the base link: https://www.idealista.it/en/immobile/.
4. Different buffers
The nice thing is now, that you can try with as many different buffers as you like! 🔧
Personally I would cut the buffer down so the total listing number doesn’t exceed 20 which seems a reasonable number of listings to me to look through.
Just execute these lines with a different buffer radius, i.e. 300 meters.
| |
Going further
This methodology is quite simple but entirely depends on the data accessibility of the flat search page. On idealista’s page - as far as I dug into it - you need to zoom in a little until you get a response with coordinates and the respective ids.
There might be more protective pages but some of them will work in the same way and have some kind of API you can use to retrieve the results. Everything you’d need to modify is the API request to the platform and the keys in the map-function. 🪁
The best thing is: due to the flexibility of Turf.js’ buffer-function, you can either use points, lines or polygons as input geojson without modifying any code! Do you need schools for your kids or do you like to live along the riverside or a particular street? No problem: just look through your city’s open data portal and use your preferred geojson! Customize as much as you like!
If this post helped you or you managed to make it work for a different platform let me know! 🤓

