Raster-Based 3D Models with QGIS, OSM and Aerialod
Contents
Creating 3D models from raster or vector data has never been that easy! This tutorial takes you through the whole process from vector/raster data to 3D in just 3 steps.
This workflow takes you through the whole process from OSM data to the 3D model. The result will be a 3D model for the street network of a city of your choice, extruded by the speed limit value. I got the inspiration from Topi Tjukanov and it’s Barrier Effect Map.
Workflow - from 0 to 3D 🏞️
- Downloading suitable data, raster and vector format
- Understanding the differences
- Rasterizing vector data with QGIS
- Creating 3D models with Aerialod
Prerequisites
Data
- A nice raster such as digital elevation model (DEM), downloadable from NASA
- or any vector data, such as from OpenStreetMap (OSM), downloadable from Geofabrik
The latter is easier to process and can literally just be drag’n’dropped in Aerialod.
What's the difference between raster and vector data?
⬇️ Toggle me! ⬇️
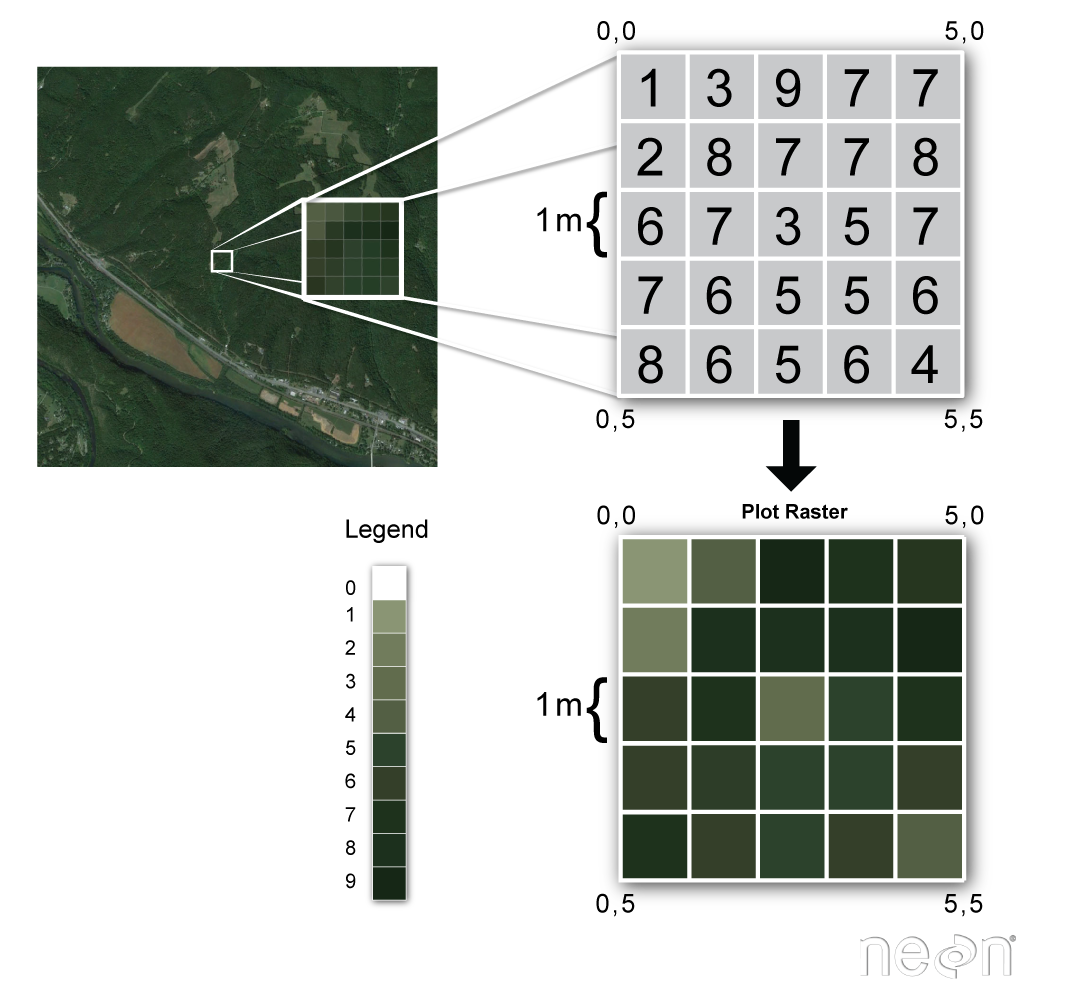
Raster data
Raster data is any pixelated (or gridded) data where each pixel is associated with a specific geographical location" - The Carpentries
Source: Neon
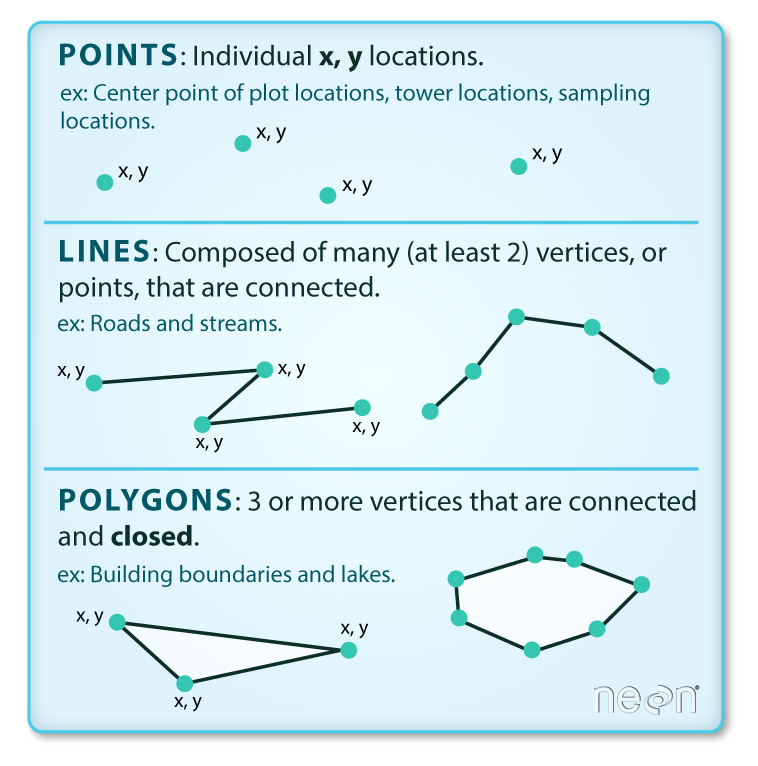
Vector data
Vector data structures represent specific features on the Earth’s surface, and assign attributes to those features. Vectors are composed of discrete geometric locations (x, y values) known as vertices that define the shape of the spatial object. - The Carpentries
Source: Neon
Software
1) Downloading suitable vector or raster data
Direct DEM raster downloads
- There are plenty of space programs in the world offering high quality DEMs. See e.g. EU’s Copernicus Program or NASA. Download a DEM of your choice but keep the extent as small as possible. You’re desktop won’t be able to render all of Africa at once. In case, you might want to clip the raster to your area of interest either with QGIS or with GDAL directly.
OSM vector downloads
UPDATE: A much faster way is to use QuickOSM plugin for this step as explained here.
- First of all, go to Geofabrik and download a small OSM subset. Ideally as small as possible as otherwise everything will take more time rendering. For Rome, I picked
IT-Centro. - Unzip the folder and look for the respective roads shapefile, in my case
gis_osm_roads_free_1.shp. - Open QGIS and drag’n’drop the file on canvas.
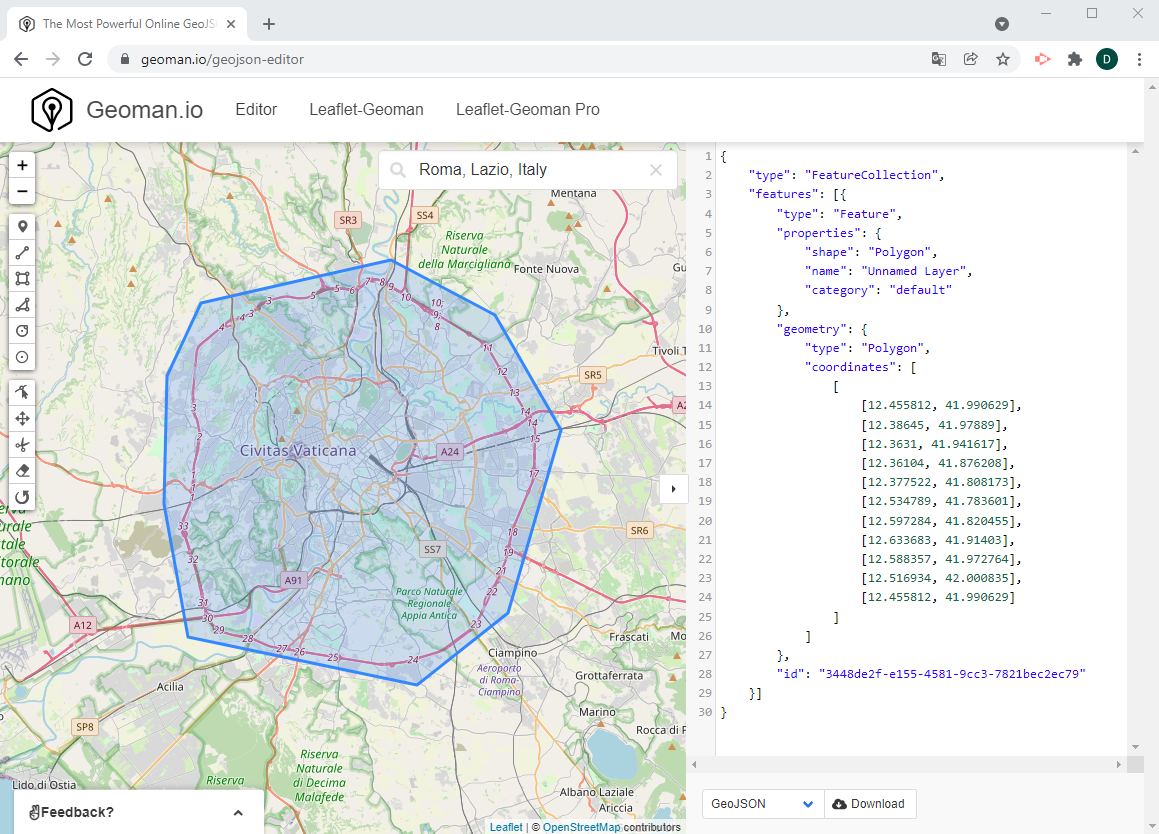
- Right click on the layer, activate edit mode and mark all the parts you would like to delete. Keep your area small for low processing times afterwards. Alternatively draw your area of interest e.g. with Geoman Editor, export the GeoJSON, drag’n’drop it in QGIS and
clipyour vector layer with the respective tool.
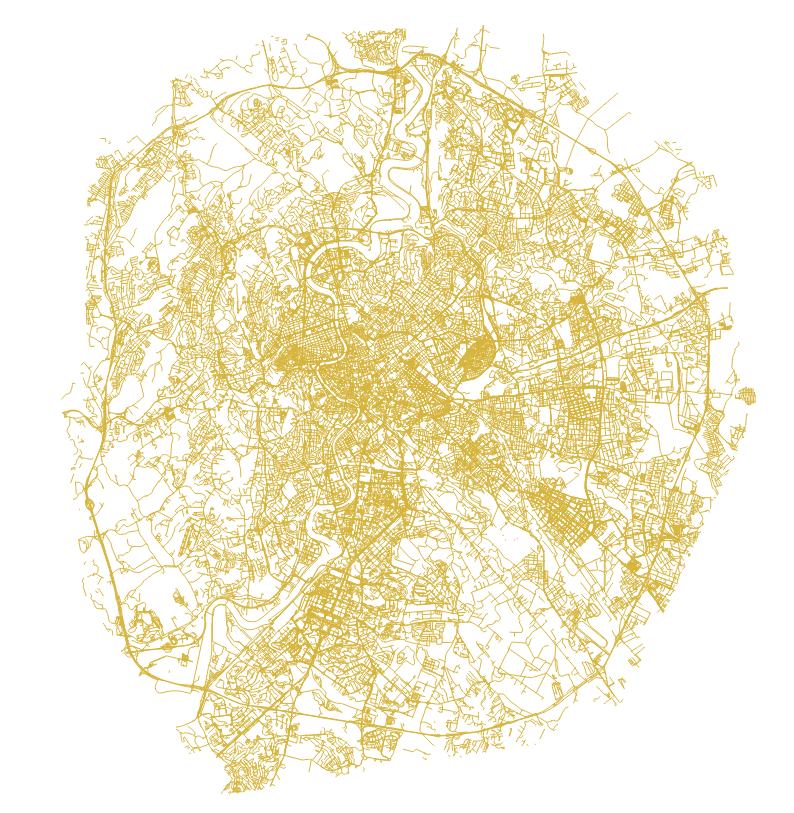
- After removal, the roads for Rome look like this:
2a) Export as raster - recommended way
Skip this step and continue to step 3) if working with DEM or similar raster data already.
This is the recommended, fast way. If you want to have more control about pixel size etc. choose the next method 2b)
For the very impatient and for testing only, simply take a screenshot from your final QGIS view and save it.
Once you want to go for you final version instead, create a proper png-Export by:
- Creating new print layout, ctrl+p
- Give it a name, e.g. “Rome”
Add element,add map(top bar) for drawing the map canvas. Snap the edges to the edges of your canvas. Your map appears.Layout,Export as image. Set the resolution or DPI higher than normal, e.g. DPI 600.
2b) Export as raster - fine tuning
This method allows for more fine tuning but takes a bit more time and trial and error. The quality is equally good to method 2a).
- Go to Tools (pane on the right) and look for “Rasterize (Vector to Raster)"-Function by typing
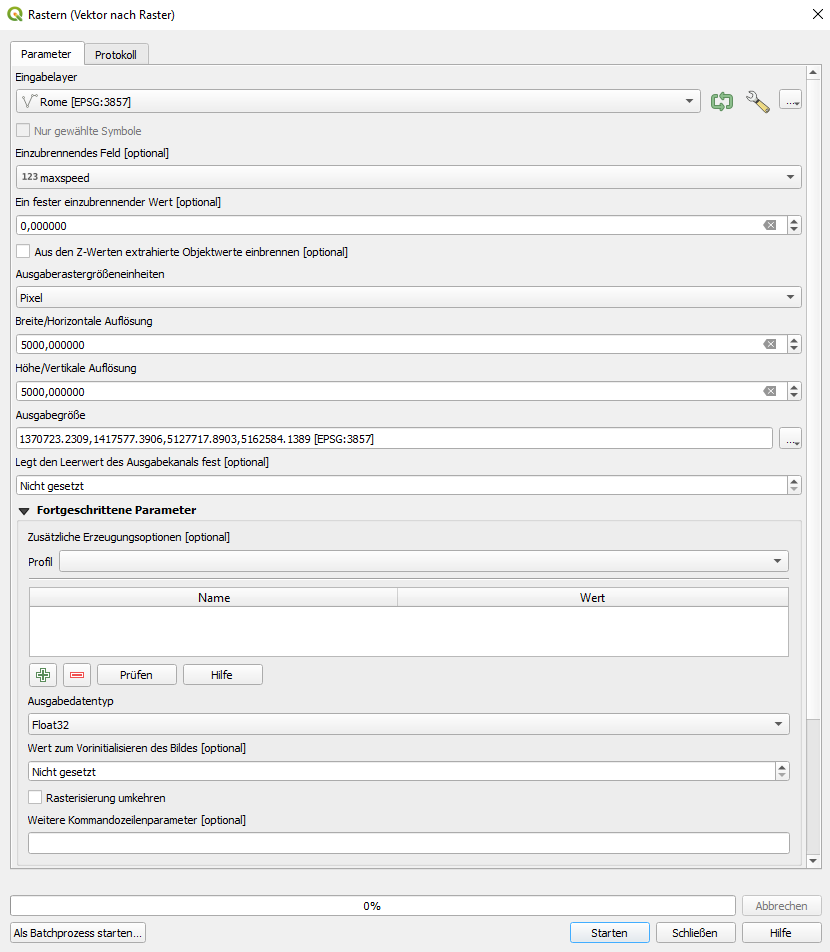
rasterizein the search bar. - Now get the settings right. You can choose a plethora of different settings, but the most important is, which field from it’s attribute table you want to assign to the pixels as values. In our case it’s “maxspeed” as we would like to create the barrier effect map. Other settings include resolution (number of pixels) and the area you would like to rasterize (current canvas). For a quick result, simply copy my settings.
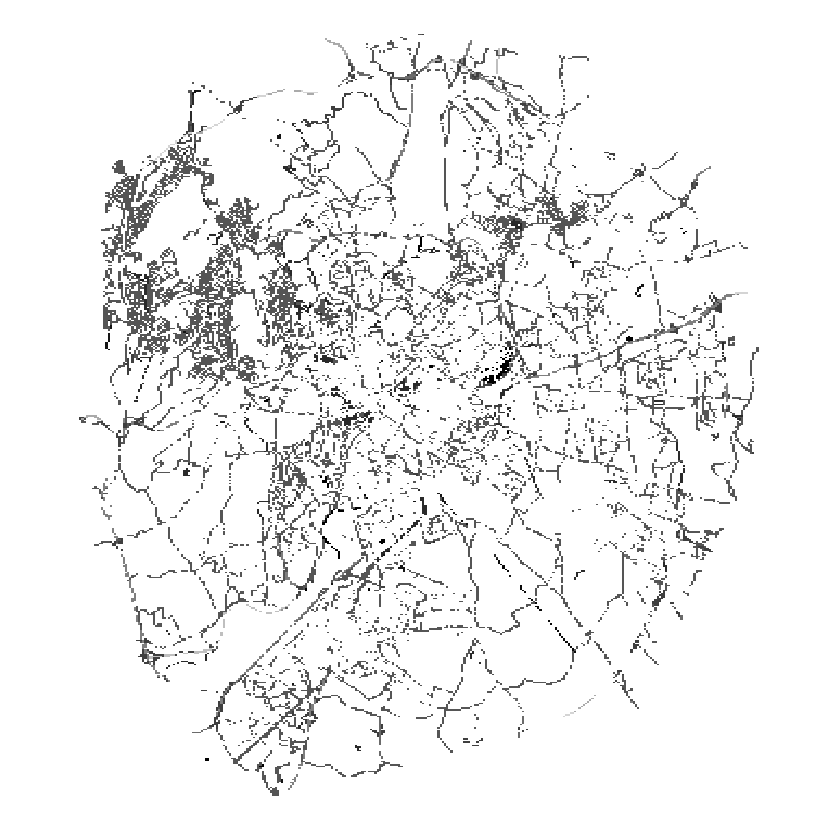
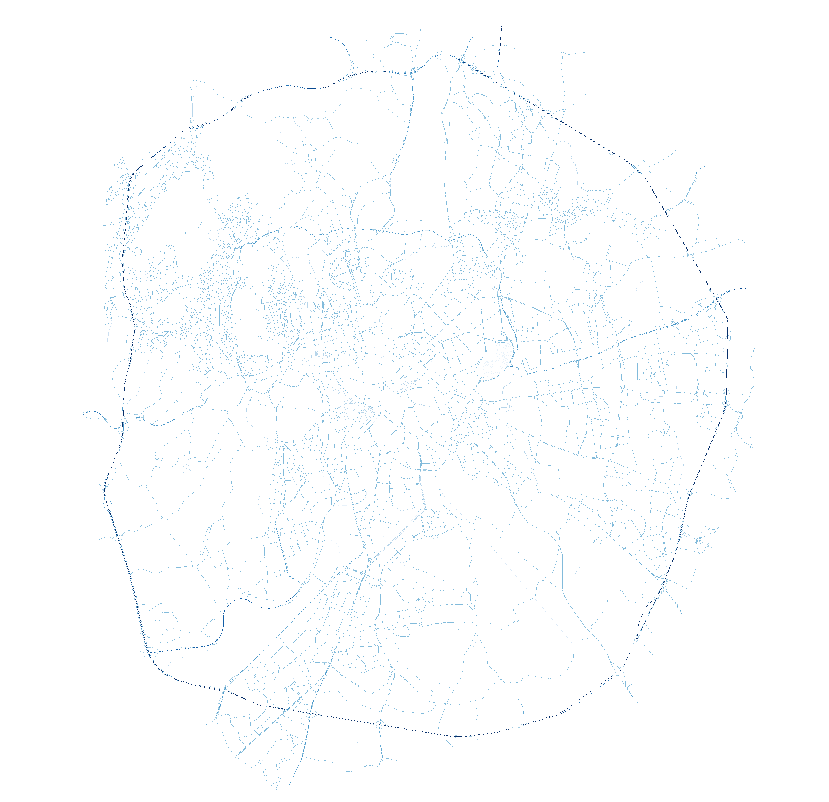
- You can already create quite different results by just changing the number of pixels. Compare below between 500x500 and 5000x5000 pixels! More pixels mean higher resolution and hence finer.
I preferred the finer resolution but if you like a more legoish effect, feel free to go with the 500x500 or less variant.
Right click on the layer, click
export asand export togeotiffor any other raster format.
3) 3D rendering with Aerialod
- Download and execute Aerialod. Simply drag’n’drop the file of your choice on canvas et voilà!
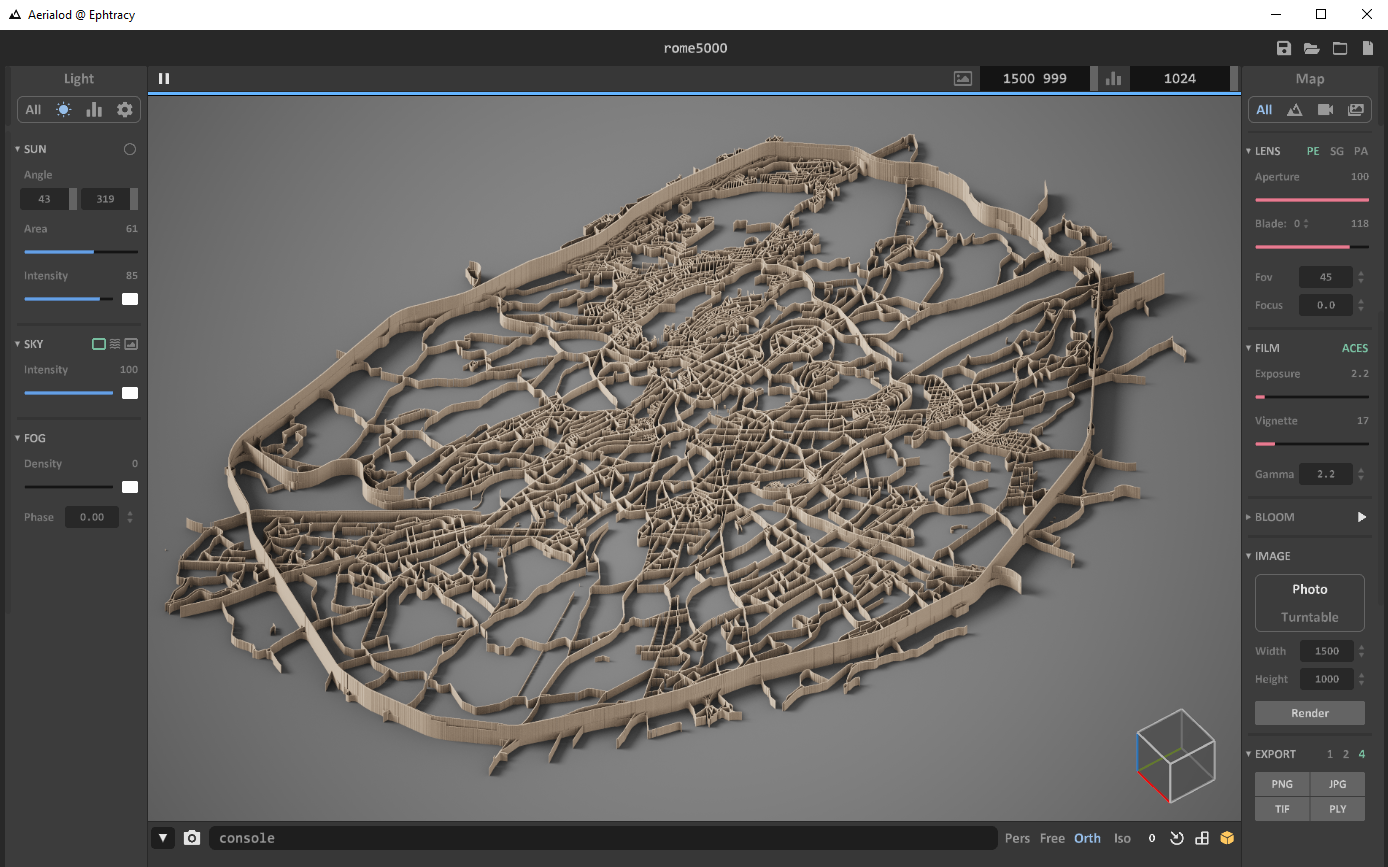
- There are tons of different settings to tweak around with. Here it’s up to you, what style you prefer. To give an impression, take a look at my settings.
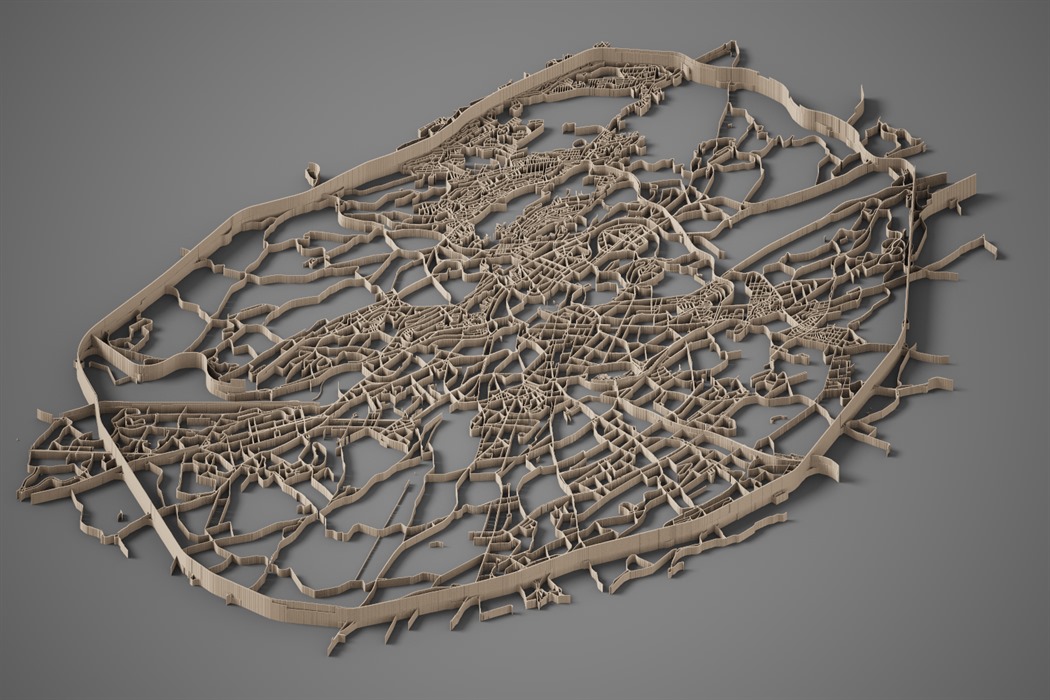
The finished result pretty much looks like a medieval town. 🏛️
If you like this tutorial or have questions feel free to let me know on Twitter, LinkedIn or via Mail! :)
