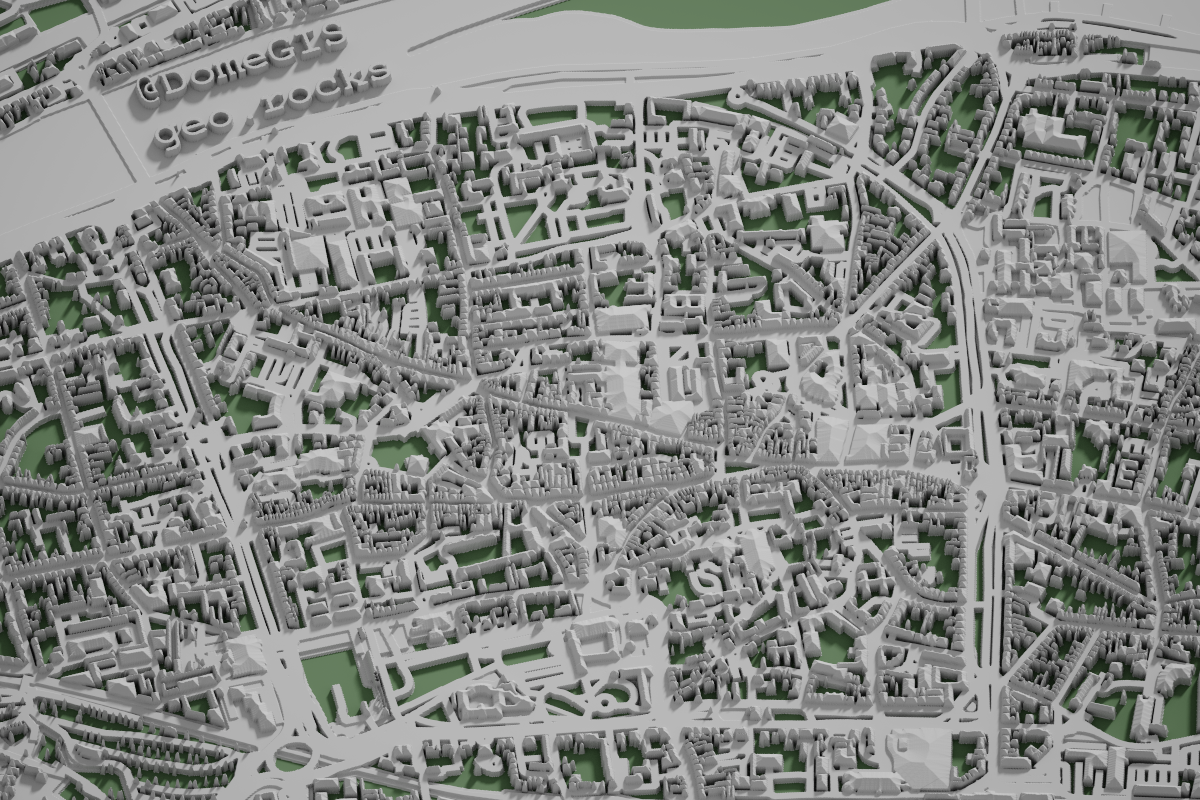
Guide to 3D OSM City Models - Trier Edition
Contents
There are few cities providing open source LIDAR data for 3D-modeling. However, leveraging OSM building, road and landuse data gives you neat city models in no time!
This is a follow-up tutorial for my first take on how to create 3D-models with QGIS and Aerialod for beginners.
Credits
- Thanks to Steven Kay for pointing out the shapeburst effect.
- Thanks to Sven Schröter for his take on Trier inspiring me to do the same based on OSM data.
- Thanks to Jerry Shannon for pointing me to QuickOSM.
Workflow
Let’s jump right in!
1. Download OpenStreetMap (OSM) data
I’d recommend installing two useful QGIS plugins for this step:
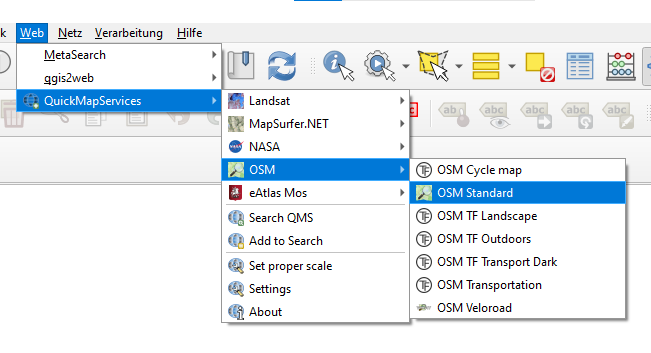
1) QuickMapServices
QuickMapServices streams OSM tiles (“basemaps”) quickly and is great for orientation.
2) QuickOSM
QuickOSM loads OSM data via OverPass API for any category.
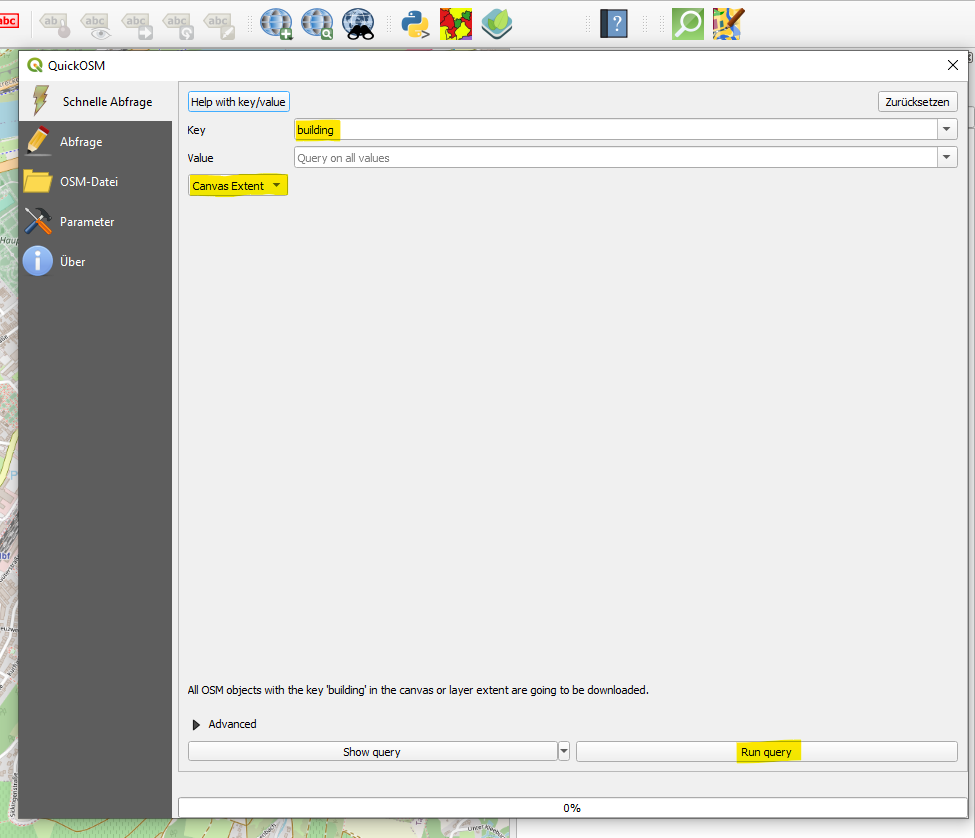
Simply open the pane after installation (green magnifying glass), enter what you are looking for, e.g. building on Canvas Extent and Run query.
After some seconds you receive all OSM data containing this particular key. You can even shrink it to certain values if you like, e.g. key: building value: industrial.
If you don’t specify particular geometry types the query will return point, line and polygon layers. Simply take a look at the layers and delete what you don’t need.
For this tutorial load the data for:
building(keep polygon layer only)highway(keep line layer only)landuse(keep polygon layer only)
If you want to go big (regions | countries | continents | planet) - what you should only do if you have the proper hardware or enough patience - you could consider downloading the files directly via API (not via the QGIS plugin) or from a different server. A reliable and up-to-date source is e.g. Geofabrik. For most people however, using QuickOSM will be sufficient.
2. Edit layers in QGIS
If you used QuickOSM, your layers are already loaded. If you downloaded the data from Geofabrik, add the following (or other layers) to QGIS via drag’n’drop:
buildings.shproads.shp
Reproject all layers to EPSG:3857 by clicking in the bottom right in QGIS as the data likely comes in EPSG:4326.
If you would like some additional subsetting for particular shapes or simply your area of interest, you should clip your layer.
I’d recommend using Geoman Editor. Simply draw a bounding box (or a polygon), download the GeoJSON, drag’n’drop it in QGIS and clip all your vector layers with the respective tool (just enter clip in the toolbox search on the right).
Rename the layers afterwards so you don’t mix them up.
Even if you don’t want to further clip your layers, create a bounding box and add it to QGIS canvas in this step as we need it later as background layer!
3. Rivers, lakes or the sea
For the city of Trier, the Mosel river was quite important in history. Even though Trier doesn’t really make use of it’s potential, the Mosel is still important to the city’s identity and we shouldn’t ignore it in our model.
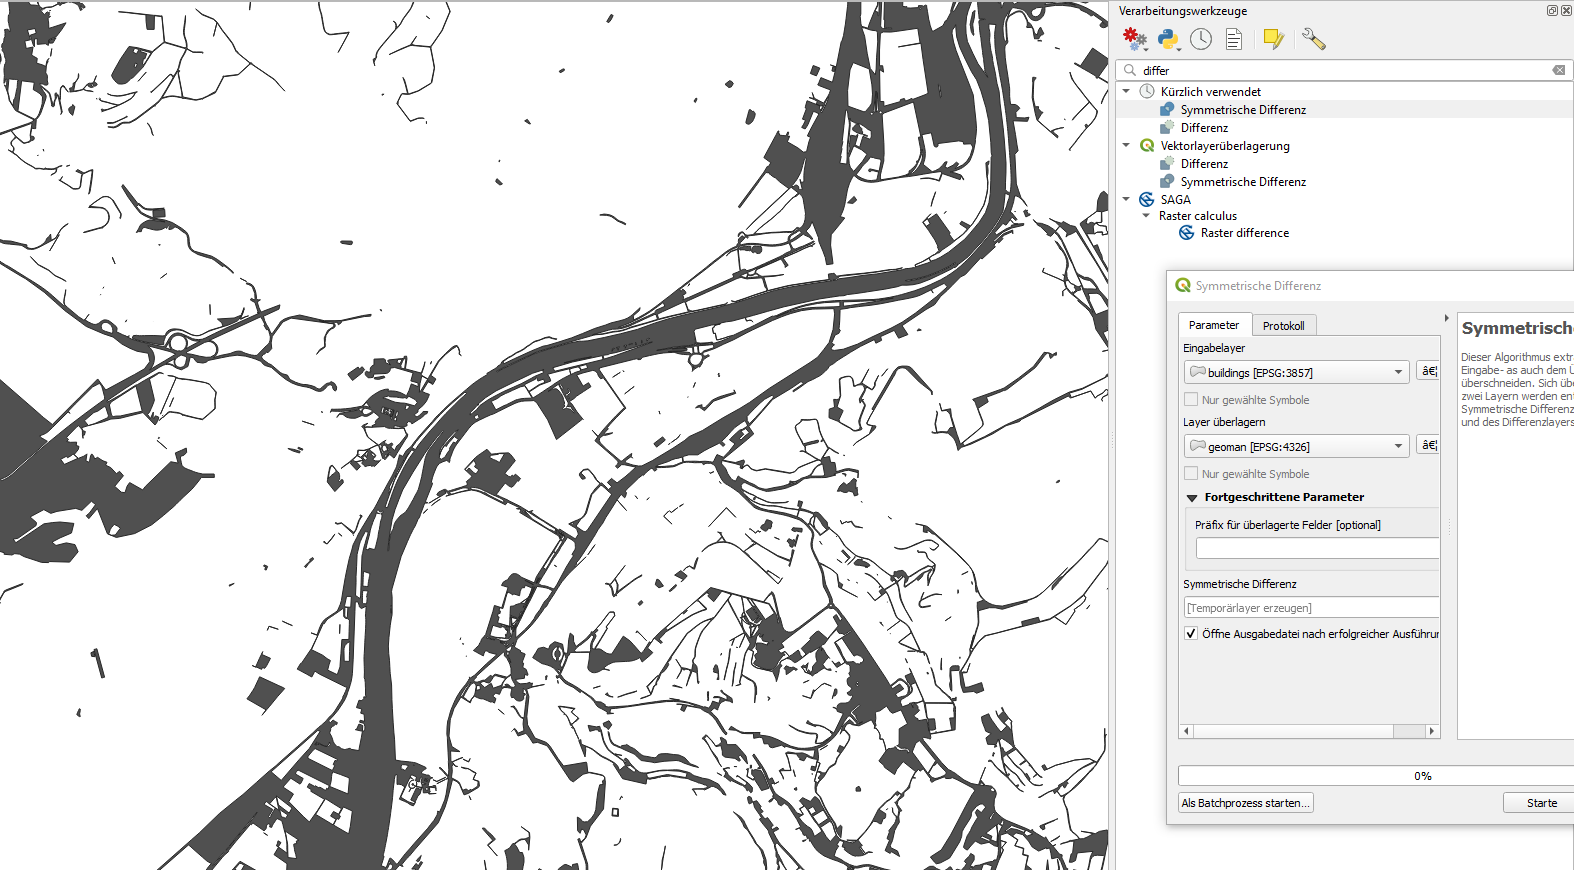
However, one can not simply use the waterways.shp as it’s a (poly-) line layer. Instead, make use of the landuse.shp. As the layer states, it classifies the landuse and not the wateruse. Still we can just take the symmetrical difference of the landuse.shp and our bounding box layer since land is (usually mostly) classified but water isn’t.
When using this tool, the symmetrical difference for Trier looks like this.
We can see that the Mosel is pretty evident but that other unclassified areas are present. If you don’t like some of them, simply erase those features by switching to edit mode.
4. Style the layers
This step is pretty important. Keep in mind, that Aerialod creates the 3D model based on the gray shades. This means that we have the freedom of blending any layers in QGIS.
The main idea, is that the darker the lower and the whiter the higher the features.
For our city model this translates to:
Riversas lowest layer (as is in reality usually) should be darkestHighwaysorRoadsas second lowest layer should be dark gray-ishBuildingsas top layer should be quite white-ish
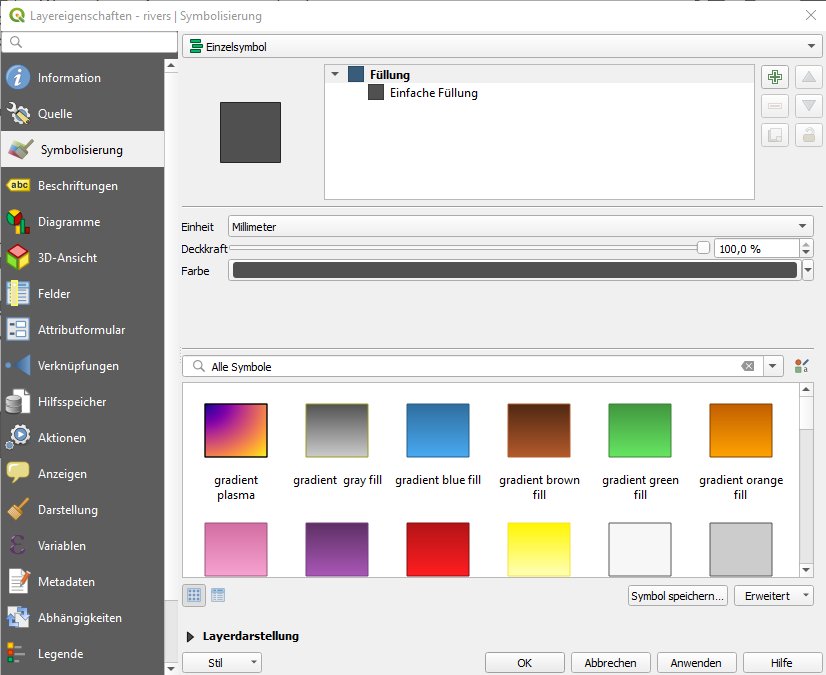
Style the river layer by choosing a simple dark gray.
Do the same for the roads but choose a slight lighter gray. Also, choose a wider line size for ‘faking’ the road width.
Feel free to add, mix or remove any layers!
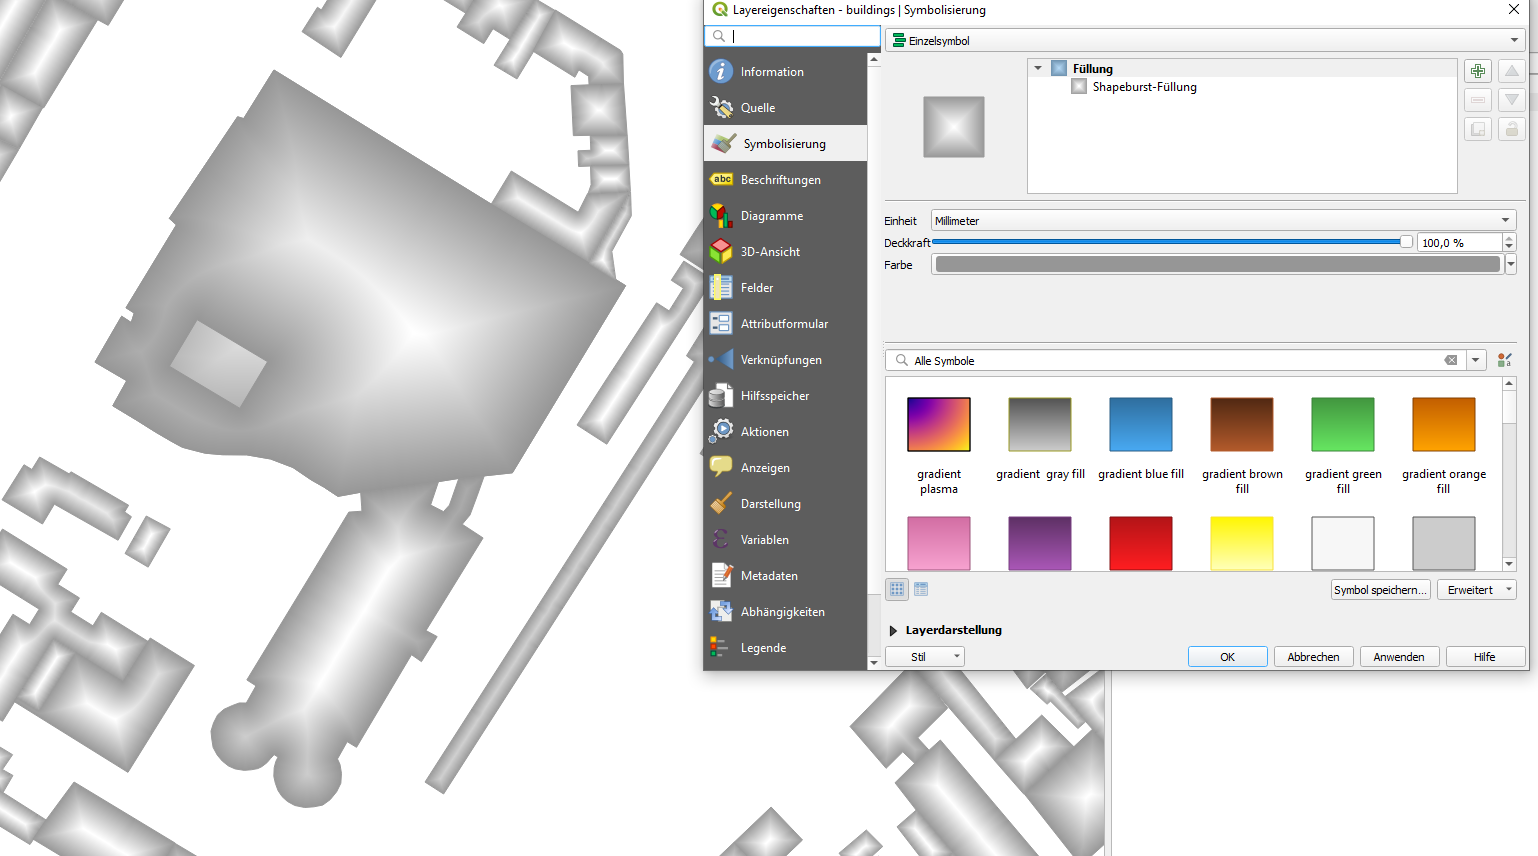
Bonus: Shapeburst effect for buildings
I spotted a really cool polygon fill effect on Twitter by Steven Kay. It uses a color gradient to the middle of the polygon, creating lighter centers and darker edges. In this way you can emulate roofs giving the whole model a more vivid feel! Apply this effect to your buildings layer and use lighter gray shades.
5. Rearrange layers
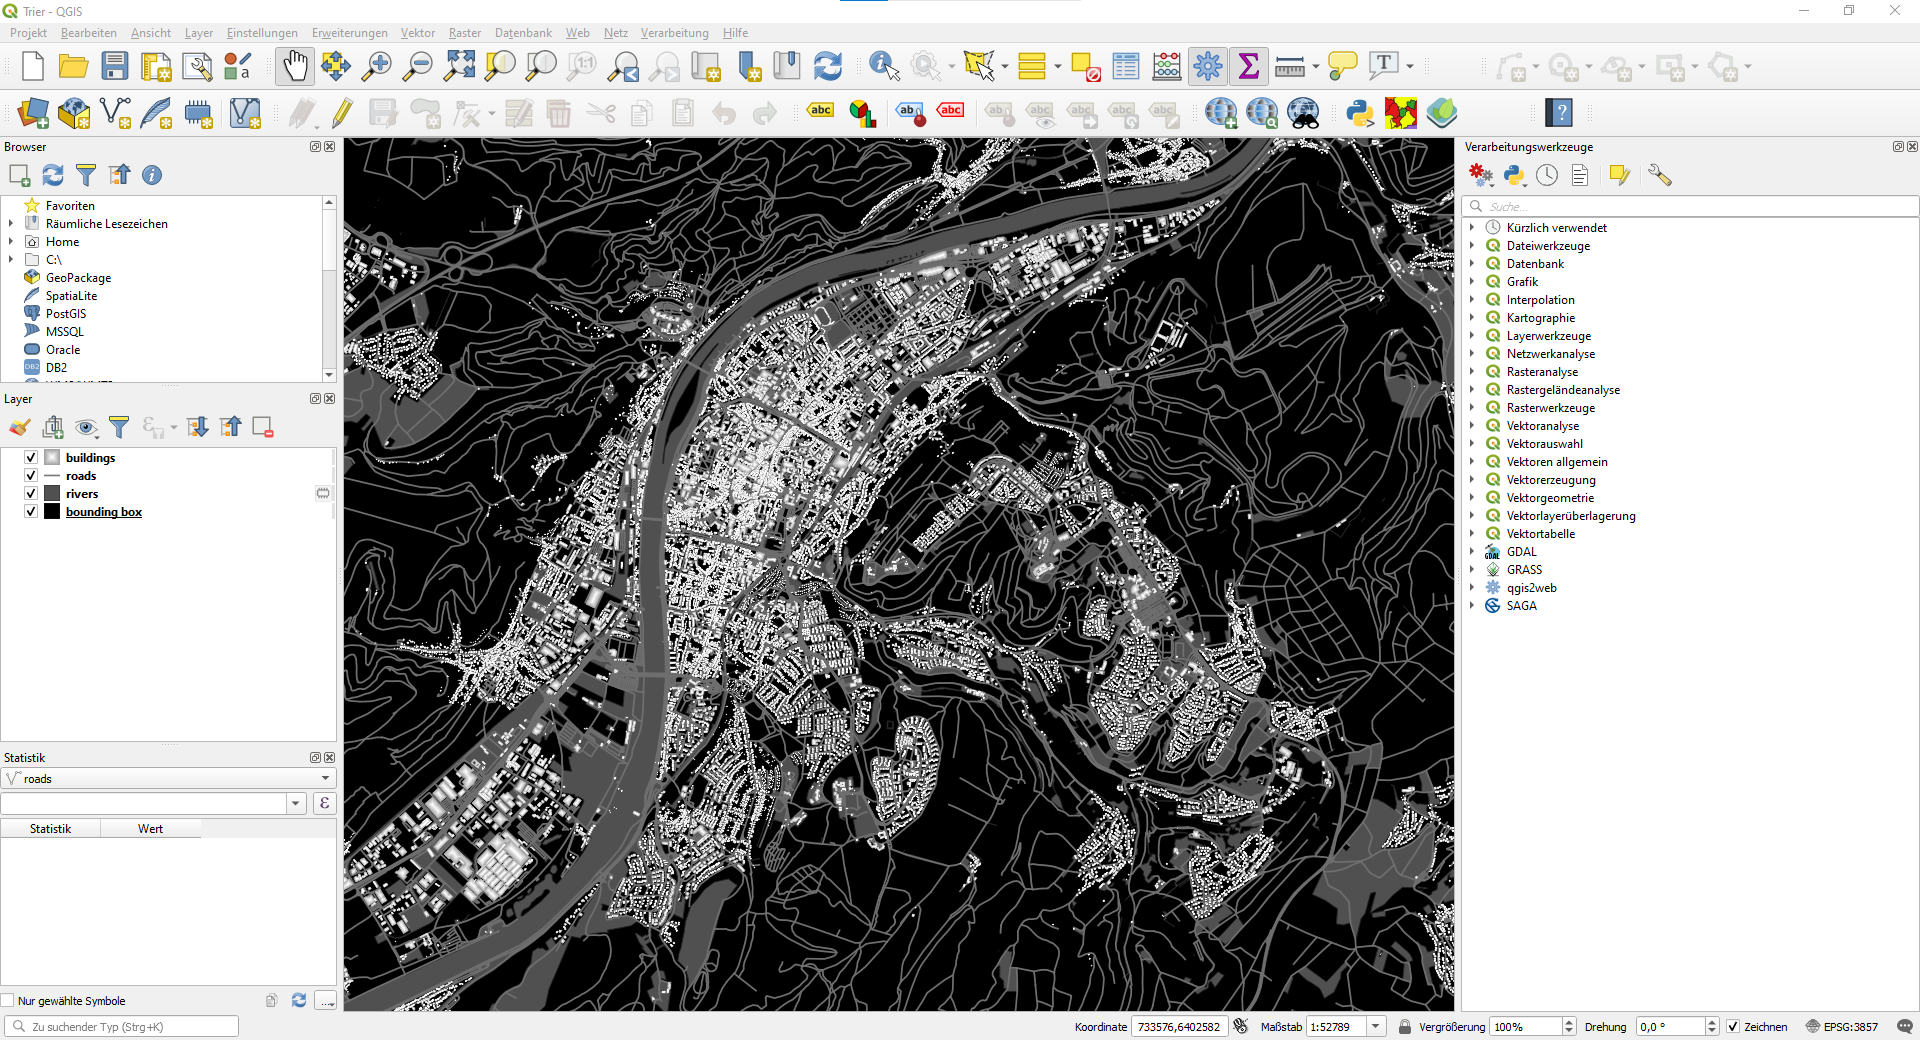
Make sure that the layers are in the right order. Additionally keep your bounding box as ground layer and set the color to black.
BuildingsHighwaysorRoadsRiversbounding box
This step is needed for the image export as otherwise we would create a negative which could be fun for creating plaster statues but I didn’t go so far - yet. 👀
6. Export as image
For the very impatient and for testing only, simply take a screenshot from your final QGIS view.
Once you want to go for you final version, create a proper png-Export by:
- Creating new print layout, ctrl+p
- Give it a name, e.g. “Trier”
Add element,add map(top bar) for drawing the map canvas. Snap the edges to the edges of your canvas. Your map appears.Layout,Export as image. Set the resolution or DPI higher than normal, e.g. DPI 600.
7. 3D-modeling in Aerialod
Aerialod is such a great piece of software. Simply drag’n’drop it on canvas and you are good to go. If it doesn’t work, click on the image preview and load it the old-fashioned way.
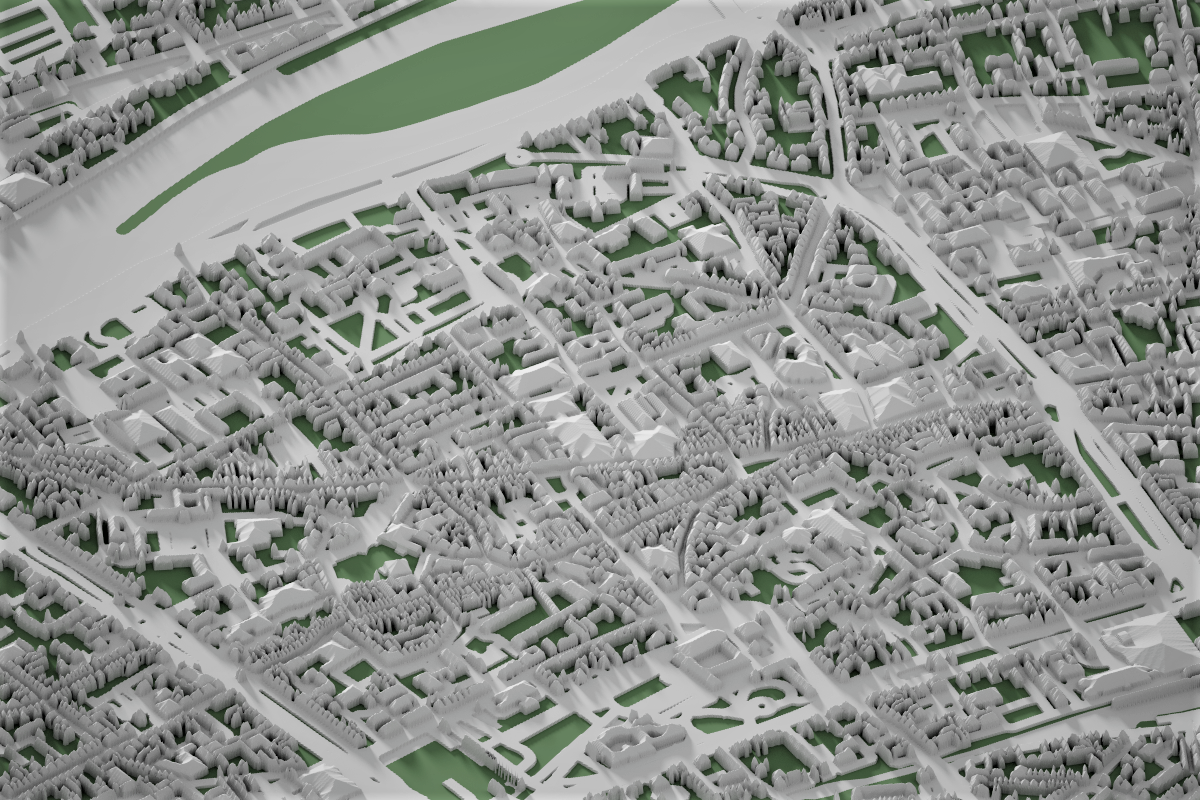
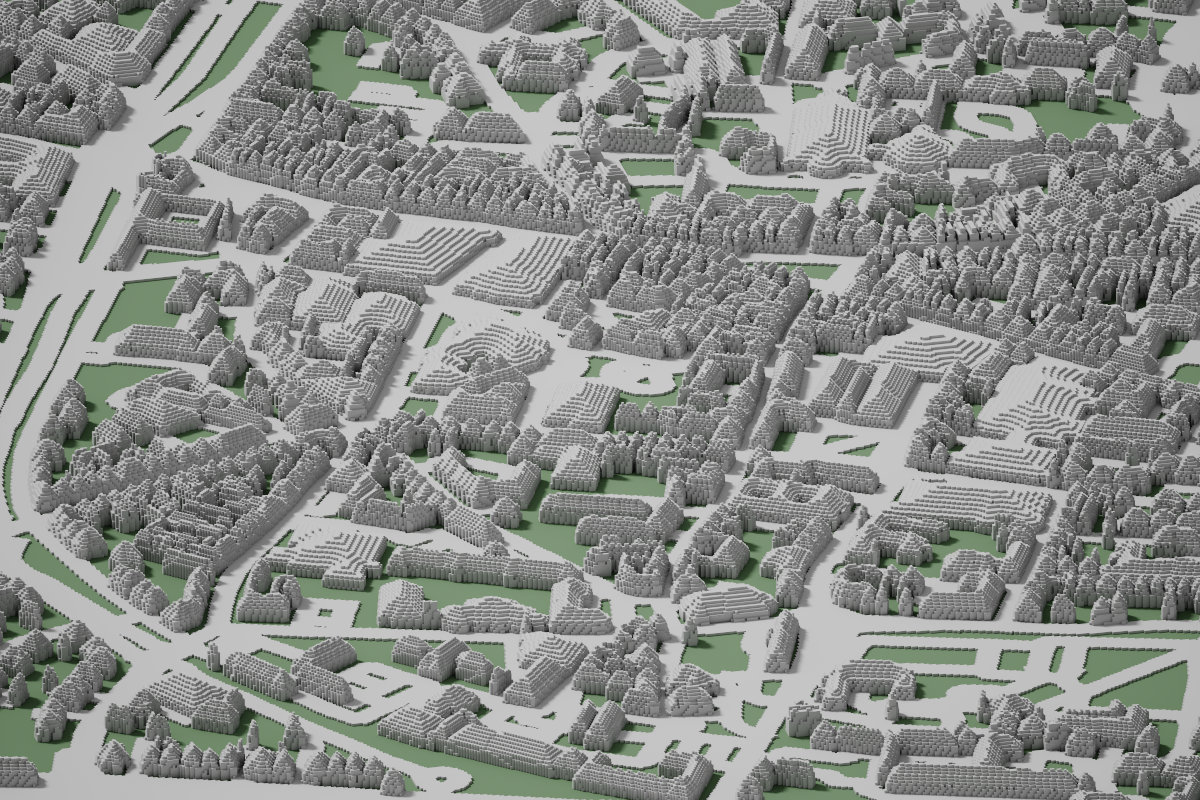
Now it’s simply tweaking around with parameters, light, shadows and perspective. Try it out and love it!
You can even create a lego map by using cube and rising step parameter.
BONUS: Map branding
For a custom branding, simply add some text to your print layout. If you want it to appear as high as the tallest building take white as color or any gray shade. Saw this way of branding a lot during #30DayMapChallenge!
