Leaflet hexbins

Leaflet-Hexbins is a powerful tool to aggregate data and visualize it quickly on a map. It can size the hexbin radius based on a feature values. But what if we used HyperLogLog data to preserve user-privacy? This post will provide a convenient way to quickly perform on-the-fly HyperLogLog unions for leaflet-hexbins.

No more backend-constraint for HyperLogLog

There are many HyperLogLog implementations out there but few work as well as postgres-hll and js-hll. They can even talk to each other by exchanging hexstrings! Usually postgres-hll is pretty much the standard extension to use, when dealing with HyperLogLog but is obviously bound to a postgres database running somewhere. With js-hll, the backend-constraint for HyperLogLog is gone, just so that users can perform any HyperLogLog action in their frontend!

Leaflet-hexbins - classic

Take a look at these jsfiddles from a fromer blog post making use of the standard implementation of hexbins.

A fixed-radius example with default settings looks like this. Find the jsfiddle here. Leaflet hexbins
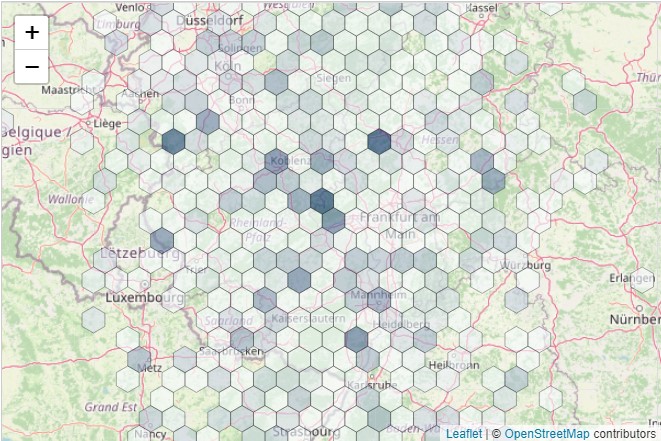
The radius is set to a fixed size so it is covering the whole area. The color scale instead is based on the number of points in a bin. Now, we can modify the hexbin by assigning a particular value to the radius. If i.e. a bin contains 3 points

1
2
3
4
5
6
posts = [
  // lat, long, users, posts
	[50.0001, 8.0001, 10, 40],
	[50.001, 8.001, 2, 5],
	[50.2, 8.2, 20, 55]
]

and we would like to set the radius to the total amount of posts (40+5+55), we would pass a reduce function summing up the values.

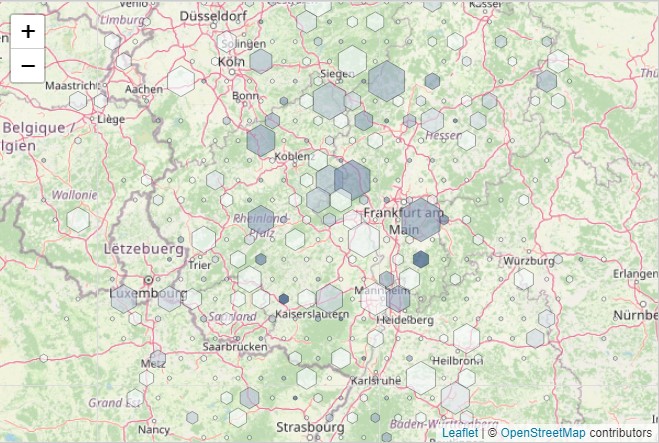
Altogether it looks like this for some sample data. Find the jsfiddle here.

Leaflet hexbins

The crucial part of the function looks like this. Note that one can pass values not only for the radius but also for the color scale and hence switch around between different visualizations if needed. In this example, the radius is set to the posts sum and the color (range) to the users sum.

 1
 2
 3
 4
 5
 6
 7
 8
 9
10
11
12
13
14
15
16
17
posts = [
  // lat, long, users, posts
	[50.0001, 8.0001, 10, 40],
	[50.001, 8.001, 2, 5],
	[50.2, 8.2, 20, 55]
]

// Create the hexlayer
var hexLayer = L.hexbinLayer({ duration: 200, radiusRange: [2, 20] })
	.radiusValue(function (d) {
		var posts_sum = d.reduce(function (acc, obj) { return acc + obj["o"][3]; }, 0);
		return posts_sum
	})
	.colorValue(function (d, i) {
		var users_sum = d.reduce(function (acc, obj) { return acc + obj["o"][2]; }, 0);
		return users_sum
	})

So far so good. Now what’s the noise with HyperLogLog?

HyperLogLog unions

Let’s assume our sample data from above was derived from a postgres-hll database. I.e. we performed some union operation in our database to group posts by geohashes or coordinates. We send the cardinalities (=distinct counts) right to our frontend.

1
2
3
4
5
6
posts = [
  // lat, long, users, posts
	[50.0001, 8.0001, 10, 40],
	[50.001, 8.001, 2, 5],
	[50.2, 8.2, 20, 55]
]

The issue with HyperLogLog cardinalities

If we simply summed up user cardinalities from coordinate A and coordinate B

1
var users_sum = d.reduce(function (acc, obj) { return acc + obj["o"][2]; }, 0);

we would count a user two times if this user posted something for both locations! If we performed simple cardinality additions, the unit would change from [distinct users/hexbin] to [distinct location users/hexbin]. For our example of a hexbin aggregating data from two locations where one user posted something for both locations, A and B, this would mean 1 distinct user but 1+1 distinct location users so 2. If you’d like a nice visual explanation, watch this video.

As we are interested in distinct users in a hexbin, we must only count such a user one time. But with a standard js reduce function this is not possible.

Js-hll HyperLogLog unions

Luckily there is js-hll to solve this problem. As postgres-hll and js-hll work well with each other by exchanging hexstrings, we can simply pass the respective hexstrings as well and perform the union right in the frontend and on the spot!

Leaflet-Hexbins with HyperLogLog

The whole trick is to make leaflet-hexbins union the hllSets on-the-fly. For every zoom level, this will happen automatically. All we need to do is to pass the right function.

Based on the above sample data, let’s provide the hexstrings in our input array. Theoretically we could drop the cardinalities entirely as we can quickly estimate the cardinality anytime but I prefer to keep them anyway.

1
2
3
4
5
6
posts = [
  // lat, long, users, posts, users-hll, posts-hll
	[50.0001, 8.0001, 10, 40,"/x128b7f8302e464ce8afce888a0d18fc3d5316e9df375ee272016a4c547157a1d337f320585bfb297a9a9591b3c725e341d38306c604ca63204afa079dba02f9003e6e8", "/x128b7f94bdc0724da3b2969d80a29cc33f1fcfafa86f548c864829faa999d06601de8f0fa2e7afa94f95292a51fecf85a1b36a39e565ddd277e29546e8acc553984ea34d60d0c9fdc544677ca2e25ef2e03419"],
	[50.001, 8.001, 2, 5, "/x128b7fd6066d41dbb57467", "/x128b7fecb2dcd9acb6b77440979b642f5d89cf"],
	[50.2, 8.2, 20, 55, "/x128b7f01446f8c8c7cc93606536482698325830735606073872d9e2920295884a7b090", "/x128b7fecb2dcd9acb6b77440979b642f5d89cf"]
]

Let’s call the hexlayer with hexbins radius set to the number of points in a bin and the color to the number of distinct users.

 1
 2
 3
 4
 5
 6
 7
 8
 9
10
11
12
13
14
15
16
17
18
19
20
21
22
23
24
25
hexLayer = L.hexbinLayer({
    colorRange: colorRange,
    colorScaleExtent: [undefined, undefined],
    duration: 200,
    radiusRange: [6, 20]
})
    .radiusValue(function (d) {
        // d is an array of the points plus values in a single hexbin
        return d.length // radius based one the number of points in the respective bin
    })

    .colorValue(function (d, i) {
        //standard summation, simply summing up all the values
        //var hexsum = d.reduce(function (acc, obj) { return acc + obj["o"][2]; }, 0);

        // performing hll union based on hexstrings array
        var hexsum = d.reduce(function (first, second) {
            return first.union(
                hll.fromHexString(second["o"][4] // index 4 of our posts data array
                .replace(/\\\\/g, "/"))
                .hllSet)}, new hll.HLL(11, 5))
                .cardinality();

        return hexsum
    })

And that’s it! Tweak around with the different visualization options, colors and radius limits as you please, add a tooltip with information as needed and a custom legend.

Creating a custom leaflet legend

 1
 2
 3
 4
 5
 6
 7
 8
 9
10
11
12
13
14
15
16
17
18
19
20
21
22
23
24
// choose intervals and color range
var legend_intervals = 10 // 0-10: 10%, 20% etc., set to lower value if needed
var colorRange = ['#f7fbff', '#08306b'];

// create a leaflet control and add to map 
var legend = L.control({ position: 'bottomright' });
legend.onAdd = function (map) {
    var div = L.DomUtil.create('div', 'info legend')
    return div;
};
legend.addTo(map);

// create value array
var leg_arr = [...Array(legend_intervals).keys()] 
leg_arr.push(legend_intervals)
var legendEntries = leg_arr.map(function (e) { return parseInt(String(e / legend_intervals) * 100) + "%"}) // percent values

// create color scale 
var colorScale = d3.scaleLinear().domain([0, legend_intervals]).range(colorRange); 

// add to leaflet control
var legend_below = d3.select('.legend').selectAll('.legend-entry').data(legendEntries).enter().append('div').attr('class', 'legend-entry');
legend_below.append('div').attr('class', 'color-tile').style('background-color', function (d, i) { return colorScale(i); });
legend_below.append('div').attr('class', 'description').text(function (d) { return d; });

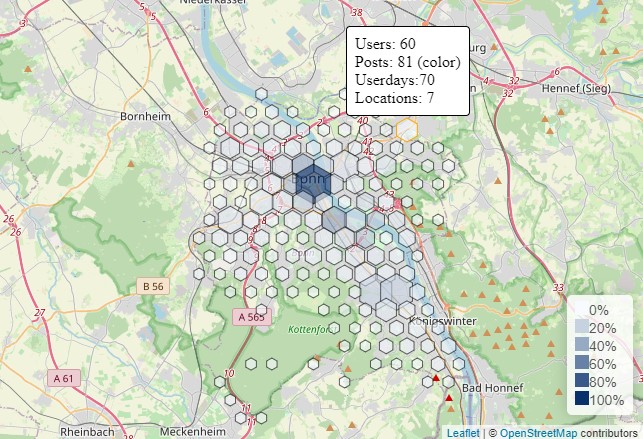
If you want to add custom tooltips displaying the HyperLogLog cardinalitites, use the same function as in the main code and add a hover handler (after .colorValue).

 1
 2
 3
 4
 5
 6
 7
 8
 9
10
11
12
13
14
15
16
17
18
19
20
function tooltip_function(d) {
    var user_cardinality = d.reduce(function (first, second) { return first.union(hll.fromHexString(second["o"][4].replace(/\\\\/g, "/")).hllSet) }, new hll.HLL(11, 5)).cardinality();
    var post_cardinality = d.reduce(function (first, second) { return first.union(hll.fromHexString(second["o"][5].replace(/\\\\/g, "/")).hllSet) }, new hll.HLL(11, 5)).cardinality();

    var tooltip_text =
        `Users: ${String(user_cardinality)}<br>Posts: ${String(post_cardinality)}<br>Locations: ${String(d.length)}`

    return tooltip_text
}

//...
L.hexbinLayer()
//...
  .hoverHandler(L.HexbinHoverHandler.compound({
      handlers: [
          L.HexbinHoverHandler.resizeFill(), // highlighting hovered hexbin
          L.HexbinHoverHandler.tooltip({ tooltipContent: tooltip_function }) // binding function
      ]
  }
  )

After polishing everything your map could look as neat as this:

Leaflet hexbins

Stay tuned for more posts! If you got any questions, feel free to contact me via mail. I’m happy to get any kind of feedback! 🦘